

Your launch monitor delivers data... we help you make sense of it with:

Your launch monitor tells you what happened. Radar Reader helps you understand what it means, what’s really holding back your performance, and what to work on first.
For Players
Upload your session and see what your data reveals—for free
For Coaches
Start your FREE 14-day trial.
Compatible with all leading launch monitors








Data alone isn't a diagnosis.
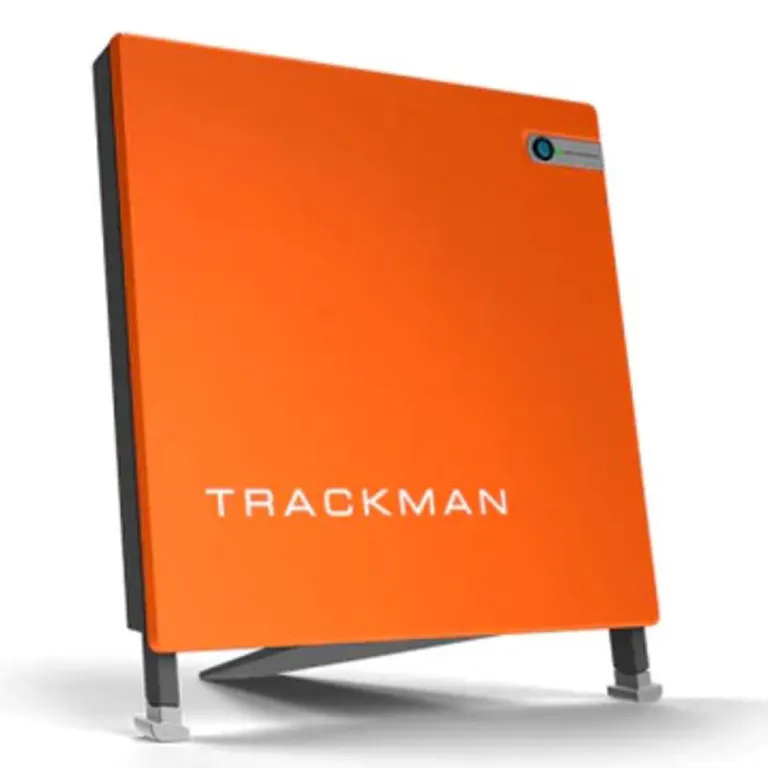
Today’s high-end launch monitors, such as TrackMan 4, deliver precise metrics including speed, dispersion, spin, carry, attack angle, and face-to-path. Yet players and coaches are left with a mountain of numbers and no clear interpretation.
What Your Launch Monitor Delivers
Individual metrics (Carry 247y, Spin 2680 rpm, Face/Path -1.2°)
Raw data with no clear priorities
Manual analysis that varies from session to session
A static snapshot of a single session
What Radar Reader Makes Possible
Clear Diagnosis: The root cause behind your dispersion
Key Bottleneck: Identify the change with the greatest impact
Practice Priorities: Know exactly what to practice this week
Progress Over Time: Track real improvement across sessions
The Solution
The operating system for golfer development. How Radar Reader works, in 3 simple steps:
1
Upload Your Launch Monitor Session
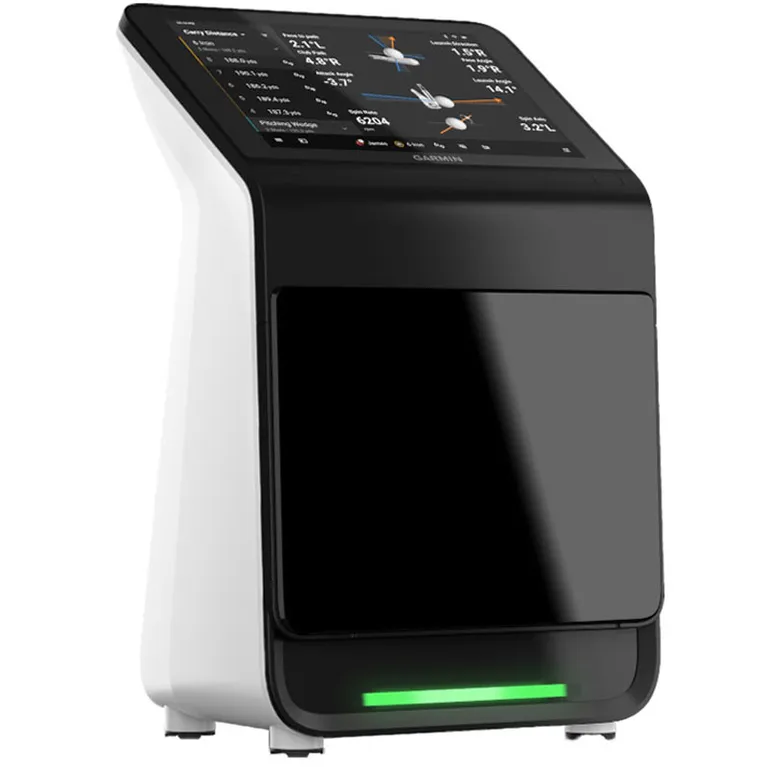
Upload your TrackMan, Foresight, FlightScope files, or any compatible dataset in seconds
2
Methodology-Based Analysis
The engine analyzes your session
3
Diagnosis and Priorities
Get a structured report with your HRGA Performance Score and the key technical priority to help you lower your scores
4
Track and Measure Progress
Compare sessions and refine your practice plan with real performance data over time
The numbers that matter,
organized with purpose.
Your Progression
How your numbers change from your shortest club to your longest. The pattern most people overlook.
Club Delivery
Ball Flight
Distance and Gapping
Dispersion and Consistency
Built to empower players and boost coaching productivity
For Players
Our approach: Simple, intuitive, and focused on your next step—without overwhelming you with 50 metrics
What’s included:
- Overall performance score and progress history
- Detailed analysis by category: driver, irons, and wedges
- Your top-priority bottleneck and an actionable recommendation for the week
- Professional reports that are easy to understand
For Coaches
Start your FREE 14-day trial.
Our approach: Maximize productivity and deliver a consistent standard of coaching.
What’s included:
- A dashboard for multiple players and coaches, with raw data, averages, and standard deviations
- Face/Path matrix, strike map, and automatic anomaly detection
- The “Share with Player”tool: choose exactly which data and notes to share with your player
- Reports branded for your academy or coaching business
Go beyond
isolated numbers.
Progression Across the Bag
See how your club delivery changes from wedge to driver. Discover the pattern a single club can’t reveal.
Prioritize Your Bottleneck
Know what to address first, in the order that unlocks the rest of your game.
Dispersion in Strokes
See what your dispersion costs you per round. Degrees can feel abstract. Strokes don’t.
Gapping
Find the gaps and overlaps in your bag.
Consistency Score
Measure your repeatability, metric by metric, against club-specific benchmarks.
Statistical Transparency
When there aren’t enough shots to draw a confident conclusion, the report tells you.
Share by Link
Send your report. Your player can open it without an account.
Your Own Methodology
Coaches and academies can set and adjust their criteria, thresholds, and terminology. Our engine. Your approach.
Know your real carry distances—not your clubhouse estimates.
Understand your typical miss and which club produces it.
See how your dispersion measures up for each club.
Find the gaps and overlaps in your bag.
Know what to work on first.
See evidence that a change made a difference.
Take the guesswork out of your practice sessions.
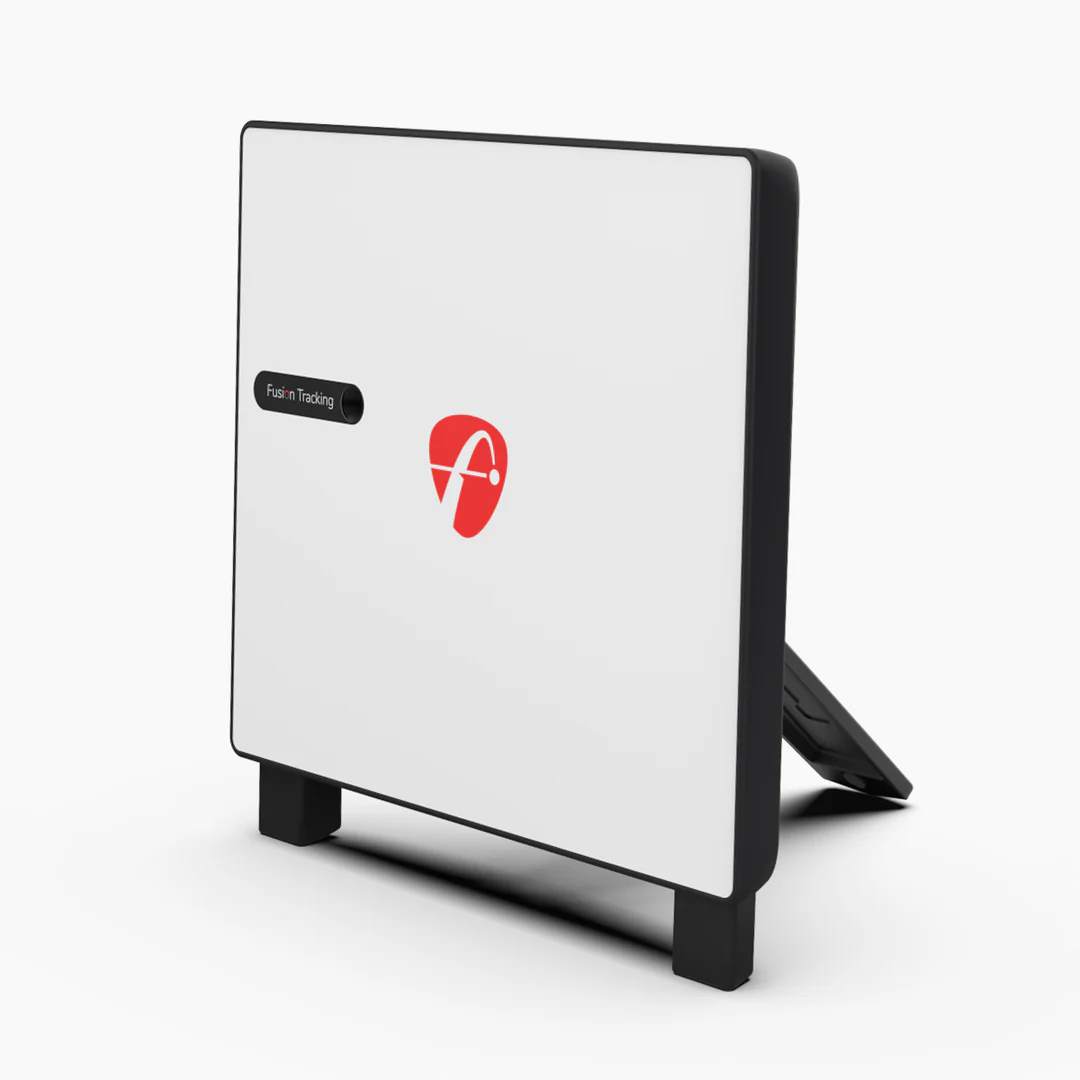
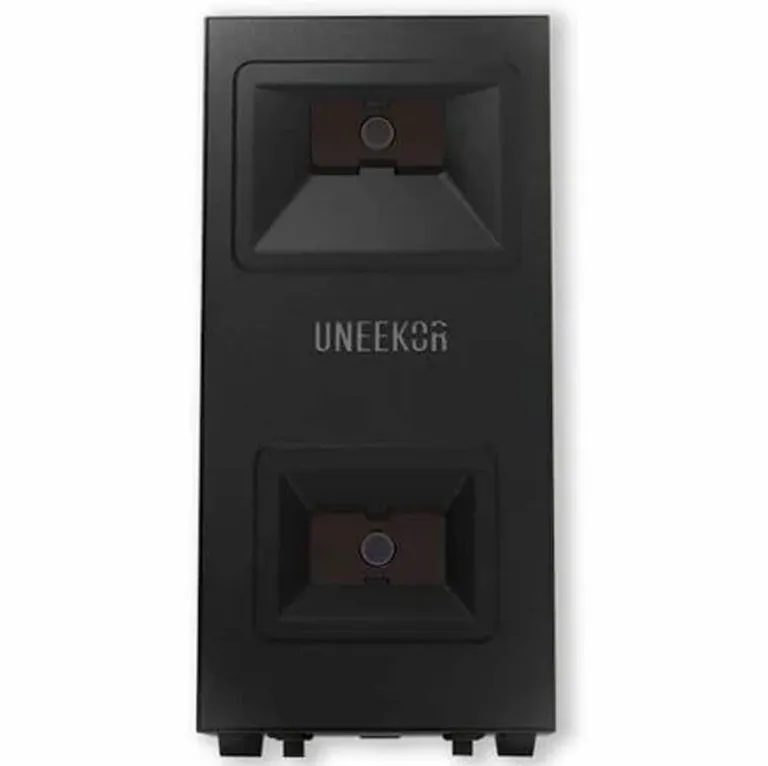
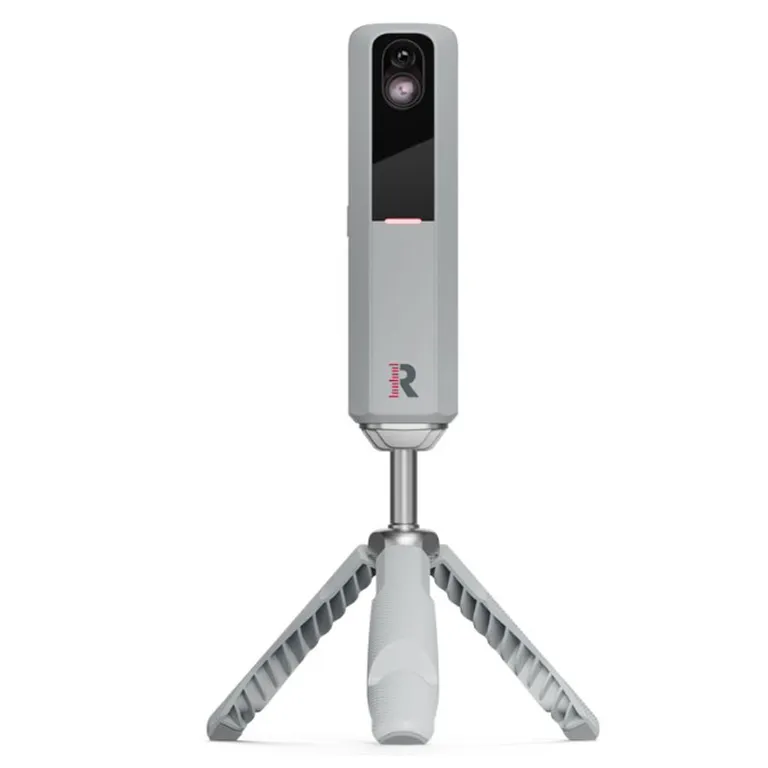
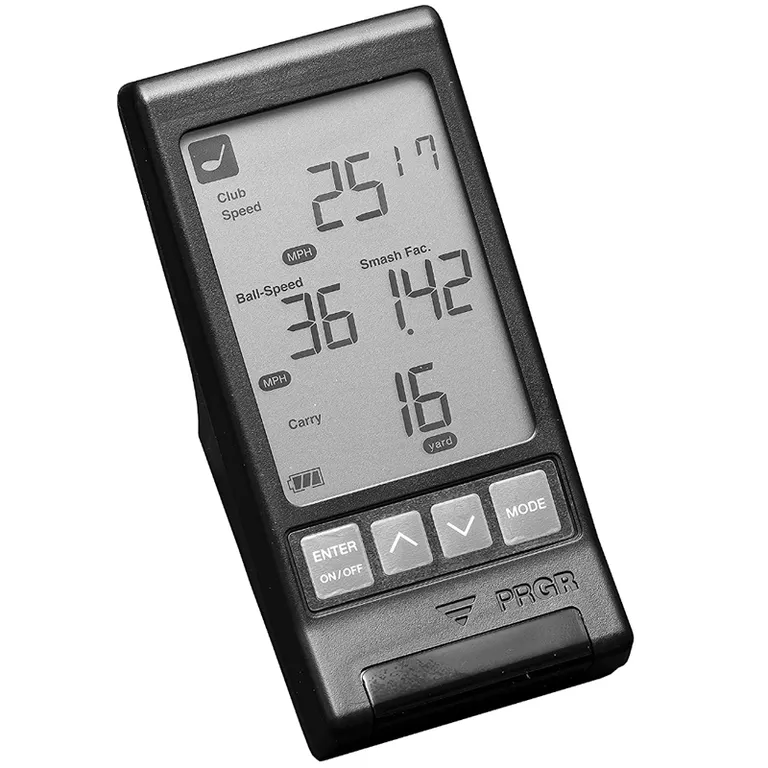
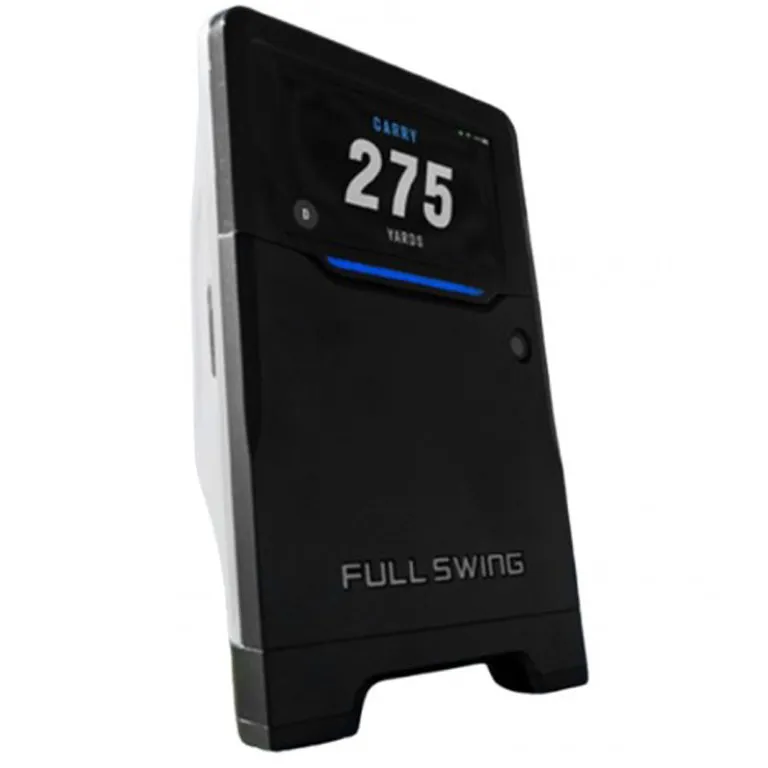
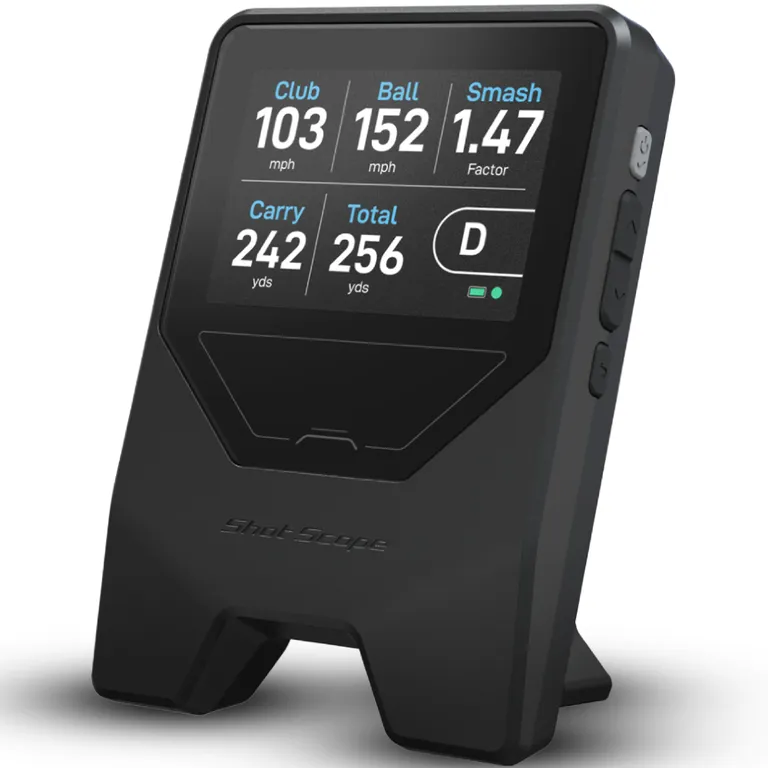
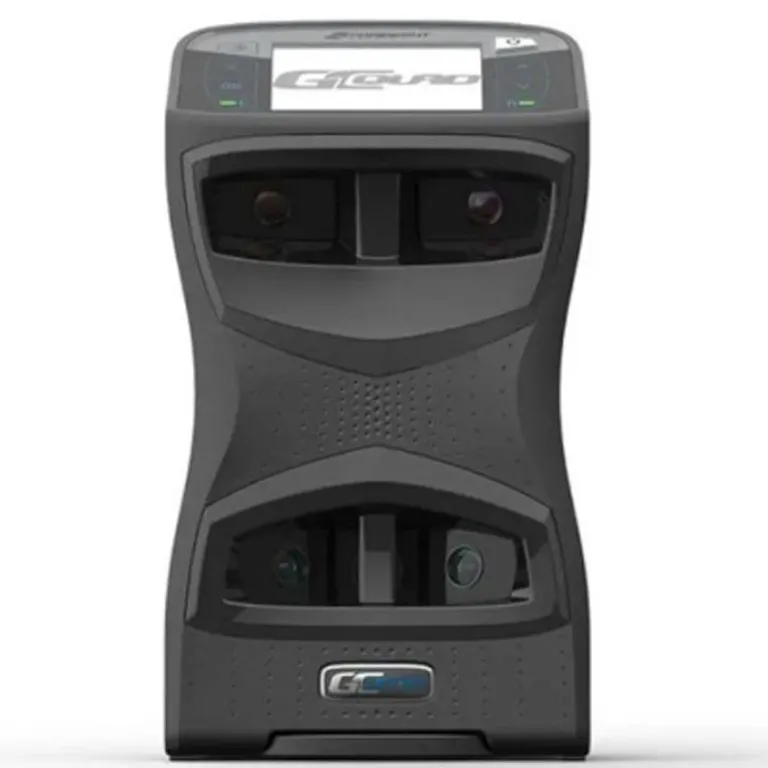
You don't have to be a pro to put your data to work.
High-Handicap Players
See where your shots really go, how far you actually carry the ball, and which club is costing you strokes.
Mid-Handicap Players
Understand dispersion, gapping, and the difference between a poor swing and a recurring pattern.
Low-Handicap and Competitive Players
Assess repeatability, uncover small inefficiencies, and see evidence that a change worked.
A launch monitor is a measurement tool, not a diagnosis
Two players have the same average club path. One repeats it on every swing. The other alternates between two very different swings that average out. Same average. Entirely different problems. Entirely different coaching needs.

THE REPORT
One session. The complete picture.
Session Report
TrackMan · 7 clubs · 112 shots
WHO IT'S FOR
One analysis. Four ways to use it.
GOLFERS: Understand Your Game
Go beyond your scorecard: know your real carries, your typical miss, and what's actually costing you strokes.
COACHES: Clear, Structured Diagnoses
Turn a launch monitor session into a diagnosis, using your criteria, your language, and your drills.
COMPETITIVE PLAYERS: Marginal Gains
Consistency, dispersion, gapping, and the one thing to address before the season starts.
ACADEMIES: A Shared Methodology
For every coach and every player. Your criteria, your language, your benchmarks.
You've already paid for the data.
Discover what it's worth...
Upload a session, see what we find, then decide.
FAQ
Frequently Asked Questions
TrackMan and Foresight Sports, including GCQuad, GC3, and GC Hawk via Session Report. We’re adding more formats based on demand.
No, but you do need a launch monitor that can export your session. We analyze the file; we don’t sell the hardware.
Absolutely—often even more so. Professionals already know their patterns. Most amateurs have never seen theirs.
An exported session with club delivery data. The more complete your export, the more detailed your report—and we’ll tell you what’s missing before you pay.
Enough shots per club to distinguish a pattern from a single good swing. If there aren’t enough, the report makes that clear.
No. Three is the minimum; six or more unlock a full-bag analysis. Using four specific clubs makes results easier to compare across sessions.
Yes. Manage your players, import sessions, analyze the data, and share reports using your academy’s criteria and terminology.
No. There’s no video or motion capture. We analyze what your launch monitor measured.
No. It organizes the evidence and identifies the bottleneck. Coaching stays in human hands.
Yes, for context. Tour benchmarks show whether a deviation is small or large for that club. They aren’t a target to copy.
Yes, for context. Tour benchmarks show whether a deviation is small or large for that club. They aren’t a target to copy.
Your data is only accessible within your account. Reports you choose to share open through private, expiring links.